When it comes to debugging in the browser’s console, getting the current DOM node, React and Vue.js components or current Angular scope are something I found very useful in my daily workflow.
In this article, you’ll learn how to get the current DOM node using $0 in the browser’s console and what to expect when you run it on the CSS pseudo-elements displayed in the elements tree.
Summary
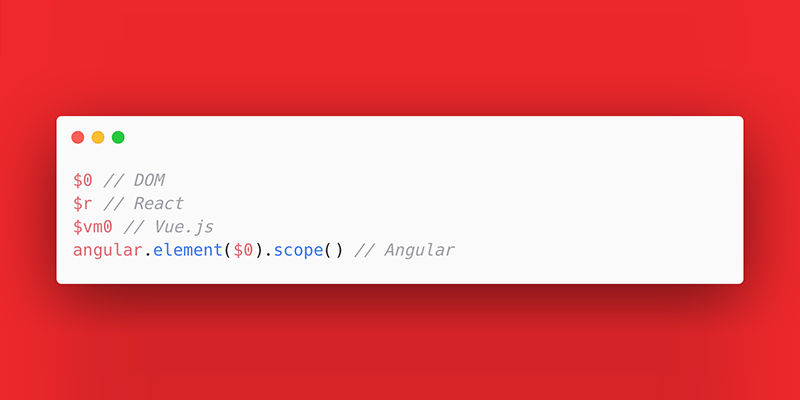
$0returns the current DOM node. The same$0on CSS pseudo-elements in the DOM returns inconsistent results across different browsers.$rreturns the current React component.$vm0returns the current Vue.js component.angular.element($0).scope()returns the Angular scope that is bound to the current DOM node.
$0
When selecting a DOM element on a page, if you’re using Chrome, for example, you may have noticed the == $0 in the elements tree next to the currently highlighted element. That means that typing $0 in the console will give you access to the returned object’s properties and methods.
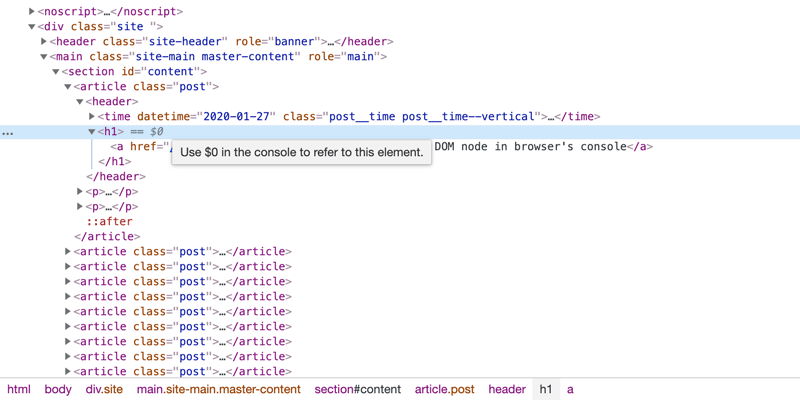
In Chrome you can see == $0 appended next to a selected DOM element and a title is displayed when you hover it.
Even though $0 is not displayed in the DOM elements tab, as in Chrome DevTools, typing $0 in the console works as expected in the other popular browsers too, as far as I tested.
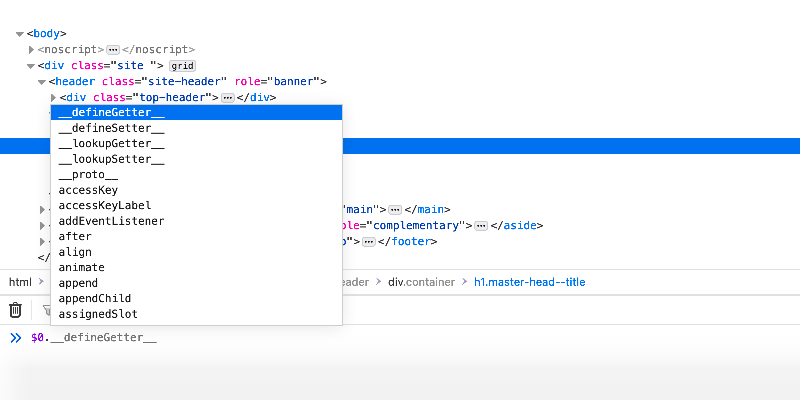
Typing $0 in the Firefox browser’s console, reveals the current object’s methods and properties.
$0 on CSS pseudo-elements in the DOM
Even though the CSS ::before and ::after pseudo-elements get displayed in browsers’ elements tree, they are not real DOM elements. Those elements are called pseudo because their content is generated by CSS, rather than HTML or JavaScript.
Pseudo-elements didn’t use to show up in the elements tree but now they do and I guess they’re not going to leave anywhere anytime soon. Having said that, if you abuse DOM element selection from browser’s Elements or Inspector tabs, there are some inconsistencies when it comes to what the console returns when typing $0 on the pseudo-elements selection:
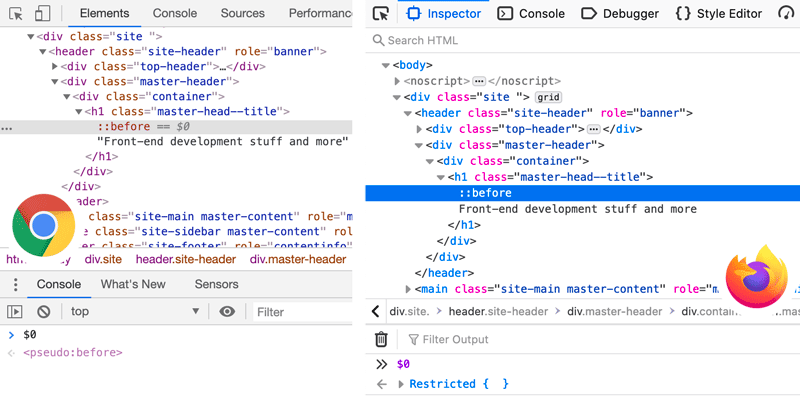
A DevTools comparison between Chrome and Firefox on pseudo-elements when it comes to trying to get the current DOM node with $0 in the console.
You may notice the returned Restricted {} object shown in the Firefox console when trying to get the current DOM node, which is a pseudo-element. At first sight, it’s not that quite self-explanatory.
Still, it seems that Firefox returns Object {}, Inaccessible {} or Restricted {} objects apparently due to script security reasons while other browsers like Chrome for example even let you add a class on the current pseudo-elements nodes referred with $0: $0.classList.add("what").
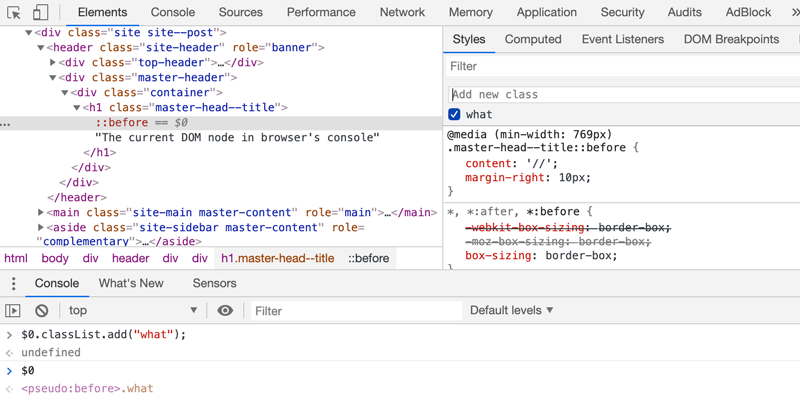
In Chrome DevTools, you can add a class on the currently selected CSS pseudo-element using the classList property and the add() method.
React’s $r
When selecting a component in React DevTools and write $r in the browser’s console, you get a reference to the selected component’s instance.
Vue.js’ $vm0
Similar to the above, if having installed the Vue.js devtools to your browser, select the Vue component and then you’ll be able to interact with it in the browser’s console using $vm0.
Angular’s angular.element($0).scope()
Similar to React and Vue.js components, in Angular, a scope is an object that contains the application data and methods. Using the AngularJS Batarang extension in your browser, you can use angular.element($0).scope() to get the Angular scope that is bound to the current DOM node $0.
Edge, extensions and DevTools naming convention
-
The newly released Edge browser supports extensions installed from other stores, e.g. Chrome Web Store, so that means that besides the well-known Chrome and Firefox support, now you get Microsoft Edge browser support too for the popular JavaScript frameworks.
-
Note that selecting the React and Vue.js components or Angular current scope mostly works for applications that are built in development mode. In most cases, when the production mode is set as
true, that is the intended behavior. -
The DevTools naming convention is unanimously used by most of the popular browsers when it comes to their integrated development tools. Oh, and there’s Safari that uses Web Inspector.
Browser and development tools
- Firefox Developer Tools - Console
- Chrome DevTools - Console
- Microsoft Edge (EdgeHTML) Developer Tools - Console
- Safari Web Inspector
- Opera DevTools
Also, if debugging is something you’re interested in, you’ll also like the vanilla JS remove() method and to fiddle with JS and the Clipboard API.
Update on
While writing this article down, I also filled a bug report for this Chrome DevTools behavior. Two days later, the bug was fixed already and I couldn’t be impressed more!